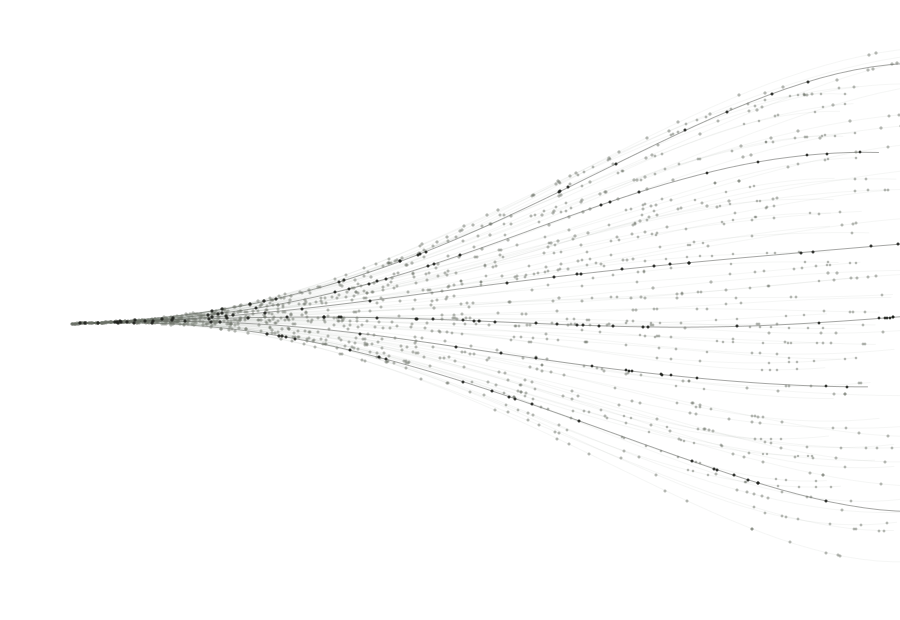
We built three simulated business operations, gave frontier AI their imperfect records, and asked it to choose an operating plan and predict the results. Then we tested those plans across thousands of simulated futures.
Change a schedule, a stock level or a staffing rule, and you see what happened. You don’t get to replay that same moment with a different plan. It can be hard to separate a good decision from a lucky outcome.
So we built worlds you can rewind.
The AI chooses a plan for each operation. We apply it in the simulator, then measure value, cost, service and quality. Every plan faces the same luck.
MaintenanceSet inspections, part replacement, staffing and spare-parts stock.
Field serviceSet staffing, appointments, dispatch priorities and parts carried.
InvoicesHandle bills and duplicates. Set staffing, batches, review and automatic rejection.
The AI gets what a manager gets.
Partial histories, reporting gaps, and effects you can’t read straight off the data. The simulator’s rules stay hidden.
And evidence isn’t free. The records cost credits that come straight out of the final score.
Two frontier models. Three ways to work.
GPT-6.1 Sol and Claude Opus 5.5 each took on every world six times, in three setups: 108 attempts in all.
Reasoning only
Reads the evidence and answers without running code.
With Python
Can analyse the evidence in a sandbox.
Coding workspace
Shell, files and code in a restricted workspace.
Conventional
The baseline: fixed statistics and operations-research models, fitted to the same evidence.
Choose a plan. Predict the outcome.
Each agent submits an operating plan and forecasts the outcomes, including a range of possibilities. We lock those answers before testing them on the future scenarios.
the changeits forecast range
Then we let the future happen.
Again and again, with every agent facing exactly the same luck. Then we compared what each predicted with what actually happened.
512 futures per world in the original run4,096 in the follow-up analysis
How much better could things get?
A separate search could inspect the simulator’s hidden rules. It found a best-known plan for each operation. We compare the AI’s improvement with that plan—and with continuing as before.
The score is the change in simulated net value: useful work, minus the cost of mistakes, operations and evidence. Positive means an improvement over current operations.
What happened
Each world rewarded a different instinct.
Setups ranked by change in net value over current operations, after costs, averaged over six attempts. Hover or tap a row for its % versus the statistical model (the baseline), as a share of the improvement available in that world.
Maintenance rewarded restraint.
A factory runs 12 production lines. A seal on each line wears out and starts to leak, spoiling batches and drawing complaints.
The factory already ran well: little to gain, plenty to break. Claude, thinking it through, came first. Given tools, it did worse.
Maintenance: setups ranked by change in simulated net value over current operations.
current
1Claude Opus 5.5Reasoning only+81%Rank 1. Claude Opus 5.5, reasoning only: +0.46% change in simulated net value versus current operations; +81% compared with the statistical model; all 6 attempts included.
2Claude Opus 5.5Coding workspace+47%Rank 2. Claude Opus 5.5, coding workspace: +0.23% change in simulated net value versus current operations; +47% compared with the statistical model; all 6 attempts included.
3GPT-6.1 SolWith Python+41%Rank 3. GPT-6.1 Sol, with python: +0.19% change in simulated net value versus current operations; +41% compared with the statistical model; all 6 attempts included.
4Claude Opus 5.5With Python+39%Rank 4. Claude Opus 5.5, with python: +0.17% change in simulated net value versus current operations; +39% compared with the statistical model; all 6 attempts included.
5GPT-6.1 SolCoding workspace+11%Rank 5. GPT-6.1 Sol, coding workspace: −0.01% change in simulated net value versus current operations; +11% compared with the statistical model; all 6 attempts included.
6Statistical modelBaselineRank 6. Conventional, statistical model: −0.09% change in simulated net value versus current operations; the baseline; all 6 attempts included.
7GPT-6.1 SolReasoning only−4%Rank 7. GPT-6.1 Sol, reasoning only: −0.11% change in simulated net value versus current operations; −4% compared with the statistical model; all 6 attempts included.
The opportunity
Inspect the seals every week instead of every three weeks. You catch a leak while it’s small, before it ruins a batch. Reorder spares before the shelf runs out. A system could watch both, every day.
Where others fell short
GPT replaced seals early and kept far more spares on the shelf. It was safe, but it cost too much.
Field service rewarded ambition.
A refrigeration repair firm sends technicians to food shops. If the van lacks the right part, the technician has to come back another day.
The firm’s current setup broke its service or quality limits in every simulated future, so bold changes paid off. GPT with Python ran the most analysis and came first, but its plans still broke the limits in about one future in six.
Field service: setups ranked by change in simulated net value over current operations.
current
1GPT-6.1 SolWith Python+20%Rank 1. GPT-6.1 Sol, with python: +189.0% change in simulated net value versus current operations; +20% compared with the statistical model; all 6 attempts included.
2GPT-6.1 SolCoding workspace+19%Rank 2. GPT-6.1 Sol, coding workspace: +186.7% change in simulated net value versus current operations; +19% compared with the statistical model; all 6 attempts included.
3Claude Opus 5.5Reasoning only+5%Rank 3. Claude Opus 5.5, reasoning only: +158.5% change in simulated net value versus current operations; +5% compared with the statistical model; all 6 attempts included.
4Statistical modelBaselineRank 4. Conventional, statistical model: +149.2% change in simulated net value versus current operations; the baseline; all 6 attempts included.
5Claude Opus 5.5Coding workspace−12%Rank 5. Claude Opus 5.5, coding workspace: +124.9% change in simulated net value versus current operations; −12% compared with the statistical model; all 6 attempts included.
6GPT-6.1 SolReasoning only−18%Rank 6. GPT-6.1 Sol, reasoning only: +113.6% change in simulated net value versus current operations; −18% compared with the statistical model; all 6 attempts included.
7Claude Opus 5.5With Python−49%Rank 7. Claude Opus 5.5, with python: +49.7% change in simulated net value versus current operations; −49% compared with the statistical model; all 6 attempts included.
How often each plan broke service or quality limits
Current operation100% of futures
GPT with Python16% of futures
Best-known plan19% of futures
Safer plankeeps 82% of the gain3.5% of futures
The opportunity
Every second trip costs time and money. Load the vans with the parts jobs usually need, and send technicians to overdue jobs first, closest one next. Software could plan the loads and routes every morning.
Where others fell short
Claude also hired a specialist. More jobs finished on time, but not enough to pay the extra wages.
Invoices rewarded common sense.
Two clerks process 1,000 supplier invoices a month in batches of four. Duplicates slip through and get paid twice.
A familiar problem with a known fix. GPT, reasoning alone, found the best-known plan in all 6 attempts. Given Python, it did worse.
Invoices: setups ranked by change in simulated net value over current operations.
current
1GPT-6.1 SolReasoning only+112%Rank 1. GPT-6.1 Sol, reasoning only: +0.98% change in simulated net value versus current operations; +112% compared with the statistical model; all 6 attempts included.
2GPT-6.1 SolCoding workspace+93%Rank 2. GPT-6.1 Sol, coding workspace: +0.80% change in simulated net value versus current operations; +93% compared with the statistical model; all 6 attempts included.
3GPT-6.1 SolWith Python+26%Rank 3. GPT-6.1 Sol, with python: +0.14% change in simulated net value versus current operations; +26% compared with the statistical model; all 6 attempts included.
4Claude Opus 5.5Reasoning only+23%Rank 4. Claude Opus 5.5, reasoning only: +0.10% change in simulated net value versus current operations; +23% compared with the statistical model; all 6 attempts included.
5Claude Opus 5.5With Python0%Rank 5. Claude Opus 5.5, with python: −0.12% change in simulated net value versus current operations; 0% compared with the statistical model; all 6 attempts included.
5Statistical modelBaselineRank 5. Conventional, statistical model: −0.12% change in simulated net value versus current operations; the baseline; all 6 attempts included.
7Claude Opus 5.5Coding workspace−7%Rank 7. Claude Opus 5.5, coding workspace: −0.19% change in simulated net value versus current operations; −7% compared with the statistical model; all 6 attempts included.
The opportunity
Check invoices in smaller batches, with one more person, and duplicates get caught before payment. Leave automatic rejection off, because it throws out good invoices too. Catching duplicates is the part worth automating.
Where others fell short
Most setups kept the process as it was, or checked bigger batches. Duplicates kept getting paid.
What it adds up to
No single winner.
Claude led in maintenance; GPT in field service and invoices.
More tools didn’t consistently improve decisions.
Reasoning alone led in two worlds; GPT with Python led in field service.
The top score isn’t the safest plan.
In field service, value and risk pulled in opposite directions.
A good plan is not a perfect prediction.
In invoices, GPT matched the best-known plan while its forecasts still had room to improve.
Full results: coming soon
What explains the different results?
More analysis didn’t mean better plans.
Each approach won somewhere and lost elsewhere, so how hard an AI works tells you little about whether its plan is right.
Analysing isn’t deciding.
In invoices, Python sharpened GPT’s forecasts, but its plans delivered less value.
Same evidence, different answers.
In field service, Claude chose four different plans in six tries.
In a real business, you get one future.
No rewinds, no oracle. Predicting what a change will do is hard, and no frontier model was best everywhere. You need a reliable way to test every change first.